
“Most of us grew up in a world where data were rare and expensive to collect. In contrast, culturomics is firmly situated in the 21st-century world of abundant, ‘messy’ data, produced from the interactions between humans and the digital world.”
—- Richard Ladle, Federal University of Alagoas
In the past, MEAM’s coverage of social media has focused on how social media platforms (e.g., Twitter, Facebook, Flickr, Snapchat, Instagram) can be used to communicate with and educate stakeholders and the general public. But this view of social media as primarily an outreach tool largely ignores the fact that these platforms (as well as other digital venues such as online discussion groups and internet search engines such as Google) also provide a source of publicly available information on human interactions with coastal and marine environments. Analyzing data from these platforms can tell us where people are going in coastal and marine environments, why they are going there, what they are doing once they get there, what they are seeing and hearing, and how they are feeling about it – often complete with geotags, timestamps, photographs, and videos.
A new social science – “culturomics” – studies these data to advance understanding of human behavior and cultural trends. In addition to cultural information, social media posts can provide valuable observations of coastal and marine species and ecosystems, often at lower cost than other monitoring efforts.
But as stated above, these data are ‘messy’ with many sources of potential error and bias, including lack of representation of groups that do not utilize social media heavily, overrepresentation of groups that do, intentional or unintentional errors in the raw data, and geographic biases towards areas with good internet connections.
In this issue, we learn from researchers and practitioners how they are using data from social media and other digital data sources in their marine conservation and management work (e.g., online forums to understand fishing communities, Flickr to estimate values of coral reef tourism, Twitter to help monitor and model flooding, Facebook to understand how ocean and coastal resources are used). In addition, we learn about other opportunities they see for this field, what expertise and tools are needed for this work, limitations of these sorts of data, and pitfalls to avoid in doing this work, including dealing with privacy concerns.
Ways social media and other digital data sources are being used in environmental conservation and management
- Mapping ecosystem services, particularly cultural ecosystem services
- Monitoring species, ecosystems, and seascapes, including the spread of invasive species
- Understanding human uses of marine ecosystems
- Quantifying usage of coastal and marine areas and resources, included protected areas
- Understanding illegal activities, including the illegal wildlife trade
- Identifying threats to biodiversity areas
- Analyzing human sentiment about environmental experiences
- Gauging conservation awareness and interest of the general public
- Gauging public interest in flagship species
- Determining the success of conservation and management interventions and communications.
Richard Ladle: “The only way to learn is to get your hands dirty and start generating data”: A beginner’s guide to culturomics
Editor’s note: Richard Ladle is professor of conservation biogeography at the Institute of Biological Sciences and Health at the Federal University of Alagoas in Brazil, as well as a senior research associate in the School of Geography and the Environment at the University of Oxford in the United Kingdom. He can be contacted at richardjamesladle@gmail.com.
MEAM: What are some of the most interesting ways you are seeing (or would like to see) culturomics applied to marine conservation and management work?
Ladle: To answer this question, it is important to know a little about what sort of information culturomics can generate. Culturomics is based on the analysis of word frequencies in large bodies (corpora) of text. These corpora could be websites, digitized books, social media platforms such as Twitter or Facebook, curated digital databases such as Wikipedia, or any other sort of text database. It can also be used to analyze images, either through an analysis of meta-data (e.g., tags) or after the context of the images has been classified by humans or, increasingly, by machine learning algorithms. Most culturomic analysis is fully automated – a requirement given the enormous quantities of data that are normally involved.
There are three main types of metrics that we can generate using culturomics:
- Measures of volume of content (e.g., number of websites that mention a marine protected area (MPA), number of times an MPA is mentioned on Twitter). These measures are good for assessing the cultural visibility of a place/species/practice, but they do not tell us if or how that information is being consumed.
- Measures of cultural interest, normally based on how often information is sought or viewed (e.g., number of views or language editions of a Wikipedia page for a given MPA, relative volume of Google searches for a given MPA). Cultural visibility and cultural interest are normally closely correlated.
- Measures of cultural sentiment (how people feel about it) about a place, species, or practice. This is potentially important because, for example, an MPA could be highly culturally visible (e.g., appears on lots of websites) with high cultural interest (e.g., it is frequently searched for on Google) but for all the wrong reasons (e.g., a corruption scandal, high amounts of conflict, extinction of an endemic species). Quantifying sentiment with culturomics is difficult, but occasionally possible depending on the corpora. For example, there is a range of powerful algorithms that are capable of quantifying sentiment in passages of text. At a simpler level, some web-based platforms (e.g., TripAdvisor, YouTube, Facebook) include user ratings that represent a form of sentiment (e.g., likes and dislikes).
Depending on the digital corpora being analyzed, culturomic data can be collected at high spatial and temporal resolutions, potentially providing insights and targets for marine conservation and management. As a field of academic study, conservation culturomics is very new and in a process of exploration and rapid expansion. However, there are already several interesting potential applications of culturomics that could be of interest to marine conservationists, two of which I describe in more detail below:
- Identifying new conservation emblems and conservation constituencies
There have already been several studies using culturomics to identify species with high cultural visibility and interest. So far, the focus has been on high profile taxa such as birds and reptiles, although there is ongoing work to assess the world’s fish species. This can be thought of as a systematic way of identifying flagship species, though it potentially provides much more information because it is easy to distinguish between national and international interest in a species. In addition, cultural interest can be assessed in aggregate and mapped, making it possible to identify MPAs that contain high frequencies of culturally visible species (Figure 1).
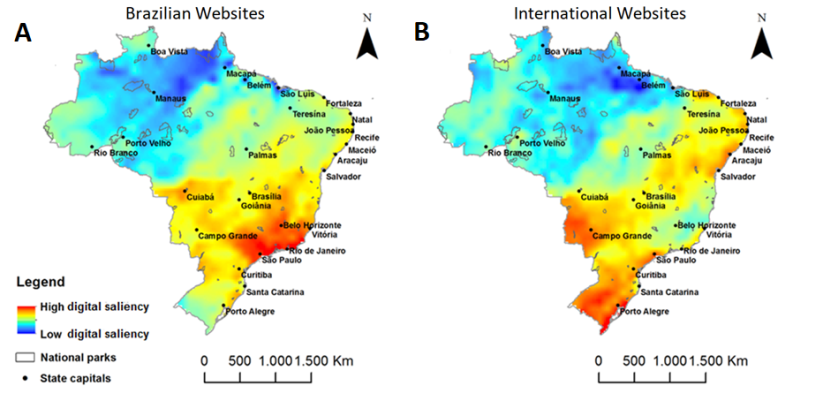
Figure 1: Aggregate cultural visibility of Brazilian bird species calculated from A) international websites and B) Brazilian websites. Figure source: R. Ladle
Data on cultural visibility/interest of species can be cross-referenced with data on biological and cultural characteristics (e.g., body size, whether it is commercially exploited, conservation threat status) from databases such as FishBase to identify potential and underutilized conservation icons and potential conservation constituencies.
- Providing new metrics and tools for near-real-time environmental monitoring and to support conservation decision making
Our ability to evaluate and monitor ecosystem services at large scales is constrained by limited and fragmented data, though this may be about to change as internet practices across the world are generating huge quantities of ecologically relevant information. Culturomics provides the tools to access and interpret some of these data. Culturomics may be especially good for measuring cultural ecosystem services (the non-material benefits people obtain from ecosystems such as spiritual enrichment, cultural identity, recreation, aesthetic experiences, and the like). For example, photo-sharing platforms such as Flickr can be scraped to retrieve data on all the geo-referenced photos taken within an MPA. These can then be analyzed (manually or automatically) and mapped in terms of the cultural service they depict. This provides MPA managers with detailed information on the type and distribution (geographic and temporal) of cultural values that are being derived from their parks (Figure 2).
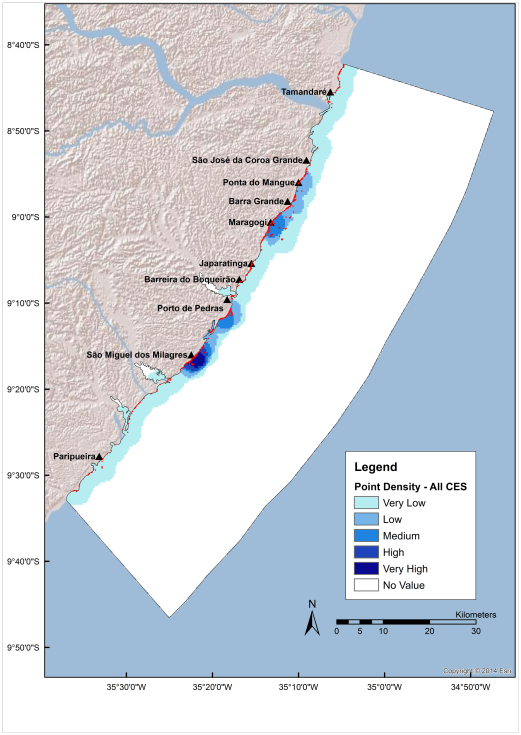
Figure 2: Map of the distribution of all photographs (2010-2016) depicting engagements with cultural ecosystem services (n=1663) in the Coral Coast MPA, northeast Brazil. Points of photographs are colored in red. Different shades of blue represent the density of photographs; darker shades of blue indicate higher density of photographs. Main human settlements along the coast are marked by a solid black triangle (Retka et al., Unpublished). Figure source: R. Ladle
More generally, culturomics is ideal for cultural benchmarking, allowing MPA managers to monitor aspects such as relative cultural visibility, cultural interest, scientific interest, etc. We recently analyzed cultural visibility (number of websites that mention the protected area) and interest (number of times protected area was searched on Google) for Brazilian terrestrial protected areas. We found big differences between designations and governance sphere (federal vs. state vs. municipal), with national parks having the highest levels of both visibility and interest. Significantly, protected areas subject to downgrading, downsizing and degazetting (PADDD) events had very low levels of both public visibility and public interest. This final result really illustrates why park managers should be aware of the cultural perceptions of their protected areas. We strongly suspect that highly culturally visible parks enjoy an element of social safeguarding, whereby threats to their integrity from development will be met by vigorous responses from NGOs and civil society. This also raises the interesting question as to whether protected area managers can significantly increase the public profile of their protected areas through “digital interventions” designed to increase internet representation.
MEAM: How would a marine conservation/management practitioner go about using these techniques? For example, do they need special software, training, or expertise (e.g., data science) or are there analyses they can do relatively easily that might be useful to them?
Ladle: Culturomic analysis is fairly straightforward, but does require a degree of familiarity with techniques and software for communicating with internet platforms. Unfortunately, there is no single interface that can be used to extract data from every type of digital corpora, although many can be accessed through the R statistical environment. The free software language Python is also very useful, especially for getting (“scraping”) data from websites. It’s also important to note that some types of data only exist in pre-analyzed form, such as information on Google searches, which can only be accessed through the Google Trends tool. Another important point to mention is that not all of these types of data are free! For example, if you want to scrape websites using Google Web Search, you need to pay for each batch of queries – this isn’t too expensive, but will soon build up if you are doing repeated searches.
Basically, the only way to learn is to get your hands dirty and start generating data. New tools are becoming available all the time, and most are free and relatively easy to get the hang of – especially if you (or someone in your office) has some programming/modeling experience.
If you don’t want to dive straight into a big data analysis, you could start by manually assessing the internet visibility (salience) and cultural interest in your MPA (and other MPAs in your region so you can assess relative progress). The easiest way to assess internet salience is to do a de-personalized search (there are several ways to do this, ask Google!) so that the results are not biased by your previous search history. When we do this we usually use search for the park name in full and abbreviated form (e.g., “Yellowstone National Park” OR “Yellowstone NP”). For cultural interest you could look at the number of page views and language editions in Wikipedia. This can be found by opening the Wikipedia page of your MPA, clicking on “Page Information” on the side bar, scrolling down to the bottom of the new page and clicking on “Page View Statistics”.
MEAM: Do you have any best practices for this work/tips for others/pitfalls to avoid? Are there any privacy issues to avoid?
Ladle: There are quite a few pitfalls and technical issues that we have run into (and probably a lot more that we are still not aware of!). The most important of these are probably:
- Be really careful with choice of names, especially if you are searching for the common names of species. There are a lot more webpages selling teal colored paint than about the beautiful little duck. We call this the “onym” problem and it occurs to a greater or lesser degree in most types of culturomic analysis.
- Culturomic data is typically generated by search algorithms that may change without warning, resulting in different results for the same search run at different times. For this reason, absolute search values are better thought of as an index of cultural visibility/interest rather than a direct, absolute measurement.
- Even if data access appears complete, data retrieval may be incomplete and/or unrepresentative because the internet corporations are protecting the primacy of their approved data providers.
- Location data are not always reliable, even if it is generated by the user’s device (via inbuilt GPS or user’s Internet Protocol [IP] address).
- Cross-cultural analysis (between countries, regions or cultural groups) may be biased because of the geography of the internet: internet penetration (the proportion of the population that has access to the internet) and the ability to generate content varies between social groups.
- You can’t treat culturomics data like the results of an experiment! Most of us grew up in a world where data were rare and expensive to collect. In contrast, culturomics is firmly situated in the 21st-century world of abundant, “messy” data produced from the interactions between humans and the digital world.
Using online forums to understand fishing communities
In October 2017, as part of MEAM’s coverage of how the social sciences are changing the way ocean conservation and management are conducted, we interviewed David Shiffman, a postdoctoral fellow at Simon Fraser University and a senior correspondent for Southern Fried Science. Shiffman and colleagues analyzed publicly-visible discussions in an online forum widely used by land-based shark anglers (fishers) in south Florida. This innovative and low-cost means of obtaining sensitive information found:
- A group of recreational shark anglers in Florida knowingly handles protected sharks. Previously, folks had assumed that anglers weren't aware that they were breaking the rules.
- Recreational shark anglers in Florida agree that shark populations have declined significantly but believe that they are not a threat to sharks and should not be regulated.
- Many land-based anglers have a strong conservation ethic but feel negatively towards environmentalists, scientists, and regulators.
- Land-based anglers self-identify as relatively young, male, and low-income compared to other angler groups and perceive themselves as having little political power relative to other groups.
These findings have important implications for managing this fishery, particularly with respect to enforcing existing laws and developing strategies to influence these stakeholders.
Spalding: Using Flickr to estimate values of coral reef tourism
Editor’s note: Mark Spalding is senior marine scientist for The Nature Conservancy’s Global Ocean Team, chief science advisor to the British Indian Ocean Territory, and honorary research fellow with the Department of Zoology at the University of Cambridge. He can be contacted at mspalding@tnc.org.
MEAM: You recently analyzed 20 million tourist photos on Flickr (an online image-hosting service) to help estimate the value of coral reefs to the global tourist economy (US$36 billion per year). Can you tell us a little bit about how you used publicly-available information on social media platforms to do this?
Spalding: We were faced with a challenge. We knew how many tourists were going to every country and how much they were spending, but we wanted to know how much we could fairly assign to coral reefs. Our first stop was then to understand how tourism values might be spread across every country, in order to select the values near reefs. So the first wave of the work was simply to use the intensity of photography on social media as a measure of where people go for tourism and recreation. We corroborated this with a separate mega-dataset on the location of hotel rooms.
The second phase had us asking how much of the tourism was from in-water activities. For this we turned back to social media and were able to sub-select thousands of underwater photos from social media and use these as a proxy for where people go. We cross-corroborated this with a citizen-populated dataset of dive sites, and again there was a great correlation. Our final maps were better than we had hoped. We were able to pinpoint how many visitors, how much was spent, and put those values directly onto the reefs which were generating them.
MEAM: Can you tell us about some other conservation and management-related areas where similar techniques might be useful?
Spalding: Some work has already been done to look at the intensity of photo uploads to understand how valuable different nature reserves and national parks are for tourism, and this is just the tip of the iceberg. We are now working with Microsoft and Esri to think about what is in the photos – that will be able to tell us so much. Image recognition and machine-learning can process millions of images in real time and be trained to find, for example, underwater photos or images of particular activities such as sailing, fishing, or whale-watching. And we can start thinking of text-based analyses to get an understanding of activities, attitudes, and preferences.
I think the point about the utility is super-important. There is growing competition for space in natural areas – in the form of mining, shipping, fishing, aquaculture, renewable energy, and tourism. Governments are increasingly keen to manage these activities, and marine spatial planning is going to increase a lot in the next decade. Meanwhile, travel and tourism are the largest employer on the planet, probably employing 1 in 10 people. But it is a competitive and un-coordinated industry, so it lacks a voice or a punch. It is also an industry which has not properly grasped its dependence on nature. With this work, we think we can: 1) raise awareness of the importance of nature and 2) provide the tools to empower industry and governments, as well as to conservationists, to step in and protect, or even to recover, natural values.
MEAM: Are these techniques something that marine conservation and management practitioners could generally do themselves, or do they need to work with data scientists or others to implement them?
Spalding: The front-line of this research is not simple, and there aren’t many people working in this field, which presents a bit of a challenge. But the concepts are simple. Practitioners can get a sense of values by simple web-based reviews using relevant social media sites. They can even quantify these at small scales (e.g., numbers of “attractions”, reviews, and likes in TripAdvisor or thinking broadly – using eBird to see where birdwatching is happening or Strava to see where people are swimming, running, biking, and boating). At the same time, we are trying hard to share our work, and the coral reef valuation work is available on maps.oceanwealth.org.
MEAM: Do you have any best practices for this work/tips for others/pitfalls to avoid? Are there any privacy/confidentiality issues to avoid?
Spalding: The social-media aspects of this work are only part of the picture, and it is really important to ground the data with application to other knowledge. We are currently refining the coral reef tourism piece, and in training the tools, we are doing a lot of cross-checking. Even when we’ve got the algorithms, the data won’t tell us value directly. So we have to review a host of government and academic data to “translate” our maps of use-intensity into values.
I’m certainly nervous about the privacy/confidentiality issues. We of course need to be highly responsible and respectful of data from social media. There’s no reason at all why we would ever need to have identities of individuals even at the initial analytical phase. It may be tempting to use quotes or images to illustrate and explain our work, but even here we should be very careful and obtain permission. I’m also worried that the awful abuses that are filling the news these days may lead to clamp-downs on access to these tremendous data-sources. I hope that restricting access to personal data can be done without this research being hampered before it has even got very far!
Using Twitter to help monitor and model flooding
Flooding in urban areas is costly and dangerous, and the spatial extent, degree, and duration of flooding can be difficult for researchers to get a precise handle on. Researchers from the United Kingdom and United States are experimenting with using artificial intelligence to extract data from Twitter (as well as crowdsourced apps such as the US-based MyCoast app) to develop extremely high-resolution maps (showing variation at the parcel and street scale) of urban flooding. These high-resolution maps could then be used to improve forecasting models and develop early warning systems to help residents and authorities prepare for flooding events.
For a recent study, researchers extracted data from Twitter by first using keyword filters such as ‘flood’, ‘inundation’, ‘dam’, ‘dike, and ‘levee’ to extract relevant tweets. This filtering of tweets over a one-month period in 2015 yielded ~ 7,600 tweets to analyze. Natural language processing and computer vision techniques were then applied to the data, and the extracted information was validated against precipitation data and road closure reports to examine data quality. The authors found that flood-related tweet volume was a good proxy for how much precipitation levels varied from normal. This sort of work is still very much a work in progress, however, and study authors describe many ways this work can be advanced (as well as the relative merits of crowdsourced vs. Twitter data).
What are the biggest challenges for conducting this sort of research? MEAM posted this question to lead author Roger (Ruo-Qian) Wang, a lecturer in the School of Science and Engineering at the University of Dundee. He told us that the biggest challenges are dealing with the heterogeneity of these unconventional data and finding authorized data (road closure announcements from the local police station for this study) to validate the data gleaned from social media and crowdsourcing.
Herter: Using Facebook to understand how ocean and coastal resources are used
Editor’s note: Jeff Herter is the assistant director of the Division of Community Resilience and Regional Programs with the New York State Department of State. He can be contacted at jeff.herter@dos.ny.gov.
MEAM: How are you using publicly-available information on social media and other online platforms (e.g., Google) in your work?
Herter: The New York Department of State Office of Planning, Development & Community Infrastructure (OPD – where New York State’s Coastal Management Program resides) is responsible for ocean and coastal planning in New York State. OPD has a mandate to provide information that can be used in planning efforts to the public and decision-makers, including data on how our ocean and coastal resources are being used. Getting our arms around this use has been a historic challenge. In addition, every five years we are obligated to conduct an assessment of our Coastal Management Program. Recreational access and use of ocean and coastal resources is part of that assessment, and it has always been difficult to try to collate these data in a meaningful way.
To help us fulfill these obligations, OPD has developed computer code that takes advantage of publicly available information on the social media platform Facebook. OPD’s Geographic Information Gateway (Gateway) harvests data from the Facebook pages of selected recreational destination points every night at midnight. Three different types of information are harvested from the selected pages:
- Likes (from the start of the Facebook page),
- Check-ins (from the start of the Facebook page), and
- Posts in the past seven days.
This harvested information is added to the Gateway’s data holdings and made accessible through a Recreational Use Hotspots “snapshot” on the Gateway’s Latest Conditions page. When the snapshot is clicked, the Latest Conditions page launches a viewer pre-loaded with those three layers.
We are now looking to add information from other social media platforms, such as Instagram, as well as expanding the type of information harvested from Facebook. We only harvest (and will continue to only harvest) publicly available information.
MEAM: Do you have any best practices for this work/tips for others/pitfalls to avoid? Are there any privacy/confidentiality issues to avoid?
Herter: We carried out a few research activities before we went down this path. First we looked at other New York State agency websites and applications to ensure we weren’t duplicating other agencies’ efforts. We also designed a survey to gauge which social media platforms most folks were using and how often they were using it. Our research showed that Facebook and Instagram use far outpaced Twitter use, so we are focusing on those two platforms.
Our team also researched the use policies of public data and determined that we were “safe” using public posts from Facebook. Instagram allows use of their public information if the organizations wanting to use their data meet at least one of their stipulations and if they find the application to be robust and operational (i.e., they will likely test the application before agreeing to an organization using their public information). I think if groups looking to use social media information to inform marine conservation and/or management check into social media platform data sharing policies and stick to public posts, they can avoid pitfalls.